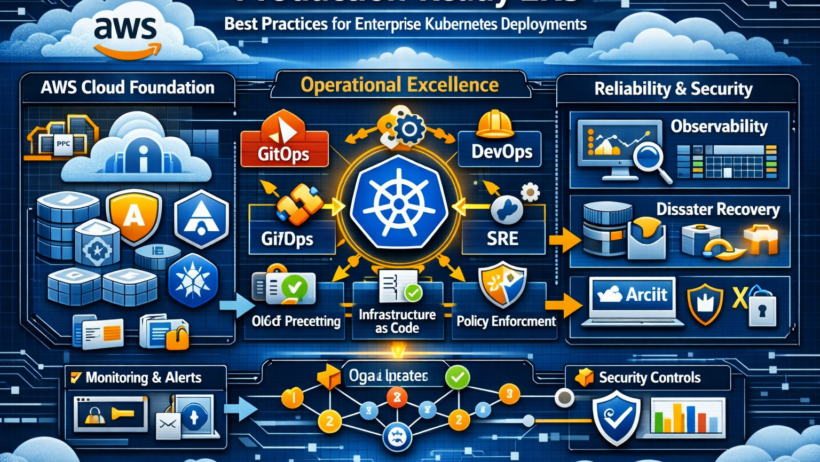

Moving a complex, multi-service enterprise application from Docker Compose to a production Kubernetes cluster on Amazon EKS is one of the most consequential infrastructure decisions a platform team can make. The lift is substantial. Done carelessly, you trade one set of operational headaches for a much larger set. Done well, you unlock scalability, resilience, and operational maturity that simply cannot be achieved with single-host container deployments.
This post consolidates the full set of best practices across every production-critical dimension: cluster foundation, scalability, governance, observability, security hardening, disaster recovery, performance, deployment safety, and long-term operational health. It is written for platform engineers, SREs, and architects who are preparing for or already executing this migration.
Table of Contents
- Cluster Foundation: Getting the Basics Right
- Scalability: Horizontal, Vertical, and Cluster-Level
- Governance: RBAC, Network Policies, and Policy Enforcement
- Security Hardening: Defense in Depth
- Secret Management: Never Store Secrets in Code
- Observability: Metrics, Logs, and Traces
- Disaster Recovery: Planning for Failure at Every Layer
- Performance: Tuning Compute, Storage, and JVM
- GitOps and Release Governance
- Deployment Safety: Protecting Production
- Cost Governance
- Compliance and Audit
- Day-2 Operations
- The Pre-Go-Live Checklist
1. Cluster Foundation: Getting the Basics Right
Every best practice downstream depends on a correctly structured cluster. Shortcuts here compound into outages later.
Multi-AZ by Default
Spread across three Availability Zones from day one. A two-AZ cluster loses quorum if one AZ fails. A single-AZ cluster is not a production cluster. Configure your EKS managed node groups with one auto-scaling group per AZ, and ensure the Kubernetes scheduler is aware of zone topology via node labels (topology.kubernetes.io/zone).
Separate Node Groups Per Workload Class
Mixing memory-intensive stateful workloads with lightweight stateless services on the same node type is a false economy. Use dedicated node groups:
- System nodes — small instances (e.g.,
m6i.large) for kube-system, ingress controllers, monitoring agents. Taint these nodes so application pods do not land here. - Stateless application nodes — general-purpose compute (e.g.,
m6i.2xlarge) for web-tier and API services with horizontal scaling. - Memory-optimized nodes — memory-optimized instances (e.g.,
r6i.4xlargeorr6i.8xlarge) for stateful, in-memory grid workloads. These workloads have precise off-heap memory requirements that must fit within instance memory with headroom for the OS and JVM overhead. - Spot/batch nodes — mixed spot instance pool for batch calculation workloads that tolerate interruption.
Enforce placement using node taints on specialized node groups and tolerations in pod specs. Never rely on soft preferences for critical placement constraints.
Essential Cluster Add-ons
These are not optional for production:
- AWS EBS CSI Driver — required for PersistentVolumes backed by EBS.
- AWS EFS CSI Driver — required for
ReadWriteManyPVCs (shared content stores, log volumes shared across replicas). - AWS Load Balancer Controller — native ALB integration for Kubernetes Ingress resources.
- cert-manager — automates TLS certificate lifecycle. Never manually manage certificates in production.
- AWS Secrets Store CSI Driver — mounts secrets from AWS Secrets Manager directly into pods as volumes, eliminating the need to store secrets as Kubernetes Secrets (which are base64-encoded, not encrypted at rest unless you configure envelope encryption).
- External-DNS — automatically manages Route53 records based on Ingress and Service annotations.
- Karpenter — modern node provisioner that provisions the right instance type for each pod’s resource request in ~30 seconds. Significantly faster and more cost-efficient than the Cluster Autoscaler for dynamic workloads.
- Velero — cluster-level backup and restore, including PersistentVolume snapshots.
2. Scalability: Horizontal, Vertical, and Cluster-Level
Horizontal Pod Autoscaler (HPA) for Stateless Workloads
HPA is the correct tool for stateless, deployment-backed workloads. Configure it based on CPU utilization with a minimum replica count that already satisfies your availability SLO:
minReplicas: 2      # never go below 2 for production availability
maxReplicas: 8
targetCPUUtilizationPercentage: 70
Target 70% CPU, not 90%. At 90%, the scaling reaction is too slow — by the time HPA triggers, your pods are already saturated.
StatefulSet Scaling for In-Memory Grid Workloads
StatefulSets running in-memory data grids (Apache Ignite, Hazelcast, etc.) cannot use HPA. Scaling adds a new grid member, which triggers data rebalancing. This must be a deliberate, supervised operation — not an automatic response to a CPU spike. Scale StatefulSets via controlled Helm upgrades with human review, not automation.
For distributed subordinate/calculator nodes that are compute-only and do not hold primary data, autoscaling via KEDA (Kubernetes Event-Driven Autoscaling) or Karpenter is appropriate since these nodes can be added and removed without data loss.
Vertical Pod Autoscaler (VPA) in Recommendation Mode
Do not run VPA in auto mode on stateful workloads — it restarts pods to apply changes. Run it in Off mode to gather resource recommendations over 2–4 weeks of production load, then apply those recommendations to your Helm values deliberately. This is how you right-size resource requests and limits based on real traffic patterns rather than guesses.
Karpenter NodePools by Workload Class
Configure Karpenter NodePools that match each workload class. Constrain the instance types, capacity types (on-demand vs. spot), and AZ distribution. Karpenter reads pod resource requests and provisions exactly the right instance — no wasted capacity from over-provisioned node groups.
For memory-intensive workloads, restrict to memory-optimized instance families. For batch calculator workloads, allow spot instances with on-demand fallback. This single practice can reduce your compute bill by 30–60% on batch workloads.
Topology Spread Constraints
More expressive and reliable than podAntiAffinity for spreading pods across zones:
topologySpreadConstraints:
  - maxSkew: 1
    topologyKey: topology.kubernetes.io/zone
    whenUnsatisfiable: DoNotSchedule
    labelSelector:
      matchLabels:
        app: your-service
This guarantees that replicas are spread across AZs. With podAntiAffinity, you get best-effort — the scheduler may still place two replicas in the same zone under pressure.
3. Governance: RBAC, Network Policies, and Policy Enforcement
RBAC: Principle of Least Privilege
Every application component should run under its own Kubernetes ServiceAccount with only the permissions it needs. A Processing Engine that needs to list pods for Ignite discovery does not need permission to delete deployments. Audit your ClusterRoles and Roles quarterly. Use kubectl auth can-i --list --as=system:serviceaccount:namespace:serviceaccount to enumerate what each SA can actually do.
IAM Roles for Service Accounts (IRSA)
On EKS, application pods that need to call AWS APIs (Secrets Manager, S3, CloudWatch) must use IRSA — not instance-level IAM roles, and never hardcoded access keys. IRSA binds a Kubernetes ServiceAccount to an IAM role via OIDC federation. The credentials are short-lived, scoped to a single pod identity, and automatically rotated.
Network Policies: Default Deny
The default Kubernetes networking model allows all pods to communicate with all other pods. This is appropriate for development. For production, apply a default-deny NetworkPolicy and then explicitly allow only required traffic paths:
- Ingress controller → web-tier services
- Web-tier services → backend services
- Backend services → databases (via egress to RDS CIDR)
- Grid members → grid members (within namespace)
- Monitoring agents → all pods (read-only scrape)
Keep your VPC CIDR in a dedicated variable so it can be applied consistently across NetworkPolicy ingress rules.
Pod Security Standards
Kubernetes Pod Security Standards (PSS) replaced PodSecurityPolicy in 1.25+. Apply the restricted profile at the namespace level for production namespaces:
kubectl label namespace production \
  pod-security.kubernetes.io/enforce=restricted \
  pod-security.kubernetes.io/warn=restricted
The restricted profile enforces: non-root containers, no privilege escalation, read-only root filesystem (with explicit writable volume mounts for /tmp), dropped capabilities. These constraints should already be satisfied by well-built container images.
Admission Control with Kyverno or OPA/Gatekeeper
PSS enforces a fixed set of rules. For organization-specific policies, use Kyverno or OPA/Gatekeeper as a ValidatingAdmissionWebhook. Critical policies for enterprise deployments:
- Block images without explicit version tags (no
:latest) - Require resource
requestsandlimitson all containers - Restrict allowed image registries to approved private registries
- Require specific labels (team, environment, version) on all pods
- Block
hostPathvolumes andhostNetwork: true
Resource Quotas per Namespace
Apply ResourceQuota objects to each production namespace. This prevents a single runaway deployment from consuming all cluster resources and causing a cascade failure across other workloads. Set quotas based on expected peak load plus a safety margin, not on theoretical maximums.
4. Security Hardening: Defense in Depth
Read-Only Root Filesystem
Set readOnlyRootFilesystem: true in every container’s securityContext. Mount writable directories (/tmp, application work directories, log directories) as explicit emptyDir volumes. This prevents an attacker who achieves code execution in a container from persisting malware to the container filesystem.
Non-Root Container Users
Containers should not run as root. Set runAsNonRoot: true and specify a non-privileged UID/GID. Configure fsGroup to ensure mounted volumes are accessible to the container user. This eliminates an entire class of container escape vulnerabilities.
Deny Privilege Escalation
allowPrivilegeEscalation: false prevents a container process from gaining more privileges than its parent. Combined with dropped capabilities, this means a compromised container process cannot escalate to root even if the binary has setuid bit set.
Image Signing and Verification
Sign container images with Sigstore/Cosign before they enter production registries. Enforce signature verification at admission time using a Kyverno policy. This ensures that only images that passed your CI pipeline and were explicitly signed can run in production — protecting against supply chain attacks where a compromised registry serves malicious images.
Container Image Scanning
Scan all images for known CVEs:
- In your CI pipeline, before images are pushed to the registry (Trivy, Grype, Snyk).
- Continuously in the registry after push (Amazon ECR enhanced scanning, or Prisma Cloud).
- Block promotion of images with CRITICAL severity CVEs with no available fix.
Set a policy for medium/high CVEs: they must have an accepted risk or a remediation plan within a defined SLA (e.g., 30 days for HIGH, 90 days for MEDIUM).
Runtime Security with Falco
Falco monitors kernel system calls and alerts on anomalous behavior at runtime — behavior that static policies cannot catch:
- Unexpected shell execution inside production containers
- Writing to directories that should be read-only in production
- Unexpected outbound network connections
- Reading sensitive files (
/etc/shadow,/proc/*/mem)
Route Falco alerts to your SIEM or directly to PagerDuty for high-severity events. In financial services environments, Falco output serves as evidence in incident response and regulatory investigations.
mTLS Between Services
Internal service-to-service communication should be encrypted. If your applications already implement mutual TLS at the application layer (which they should for regulated workloads), ensure the certificate rotation lifecycle is automated. If not, deploy a service mesh (Istio, Linkerd) to provide mTLS transparently at the sidecar proxy layer without application changes.
5. Secret Management: Never Store Secrets in Code
This deserves its own section because it is the most commonly violated security principle in enterprise Kubernetes deployments.
The Problem with Kubernetes Secrets
Kubernetes Secrets are base64-encoded, not encrypted. Anyone with read access to the etcd database or the Kubernetes API has access to all secrets. Even with etcd encryption at rest and RBAC restrictions, Kubernetes Secrets are not the right long-term store for sensitive credentials.
Use a Dedicated Secret Store
Store all secrets — database credentials, OIDC client secrets, keystore passwords, API keys — in a dedicated secret management system:
- AWS Secrets Manager — native AWS integration, automatic rotation, fine-grained IAM access control, full audit trail in CloudTrail.
- HashiCorp Vault — cloud-agnostic, supports dynamic secrets (short-lived database credentials), Kubernetes auth method.
Mount secrets into pods using the Secrets Store CSI Driver. Secrets are mounted as files (not environment variables) and are never stored in Kubernetes etcd. Access is gated by IRSA or Vault’s Kubernetes auth method — the pod’s identity determines what secrets it can access.
Rotate Secrets on a Schedule
Enable automatic rotation for database credentials (AWS Secrets Manager supports Lambda-based rotation for RDS). For OIDC client secrets, rotate on a defined schedule and update the secret store — the CSI driver will pick up the new value at the next pod restart or via a secret sync daemon. Document the rotation procedure and test it before it becomes urgent.
Audit Secret Access
Every secret access to AWS Secrets Manager is logged in CloudTrail. Configure CloudWatch metric filters to alert on unexpected access patterns — for example, a pod accessing a secret it has never accessed before, or access from an unexpected IAM role.
6. Observability: Metrics, Logs, and Traces
Observability is not monitoring. Monitoring tells you when something is wrong. Observability tells you why. You need both.
The Three Pillars
Metrics
Deploy the kube-prometheus-stack Helm chart, which bundles Prometheus Operator, Grafana, Alertmanager, kube-state-metrics, and node-exporter. This gives you:
- Infrastructure metrics: CPU, memory, disk, network at node and pod level
- Kubernetes control plane metrics: API server latency, etcd health, scheduler queue depth
- Application metrics: JVM heap, GC pauses, thread pools, HTTP request rates and latencies
Enable OpenTelemetry agents for your Java applications to expose JVM metrics on a Prometheus-compatible endpoint. Annotate pods with prometheus.io/scrape: "true" and prometheus.io/port to enable automatic scraping.
Logs
Deploy Fluent Bit as a DaemonSet. Fluent Bit is lightweight (C-based, minimal memory footprint), has native parsers for Java stack traces and JSON structured logs, and can fan out to multiple destinations. Ship logs to:
- Amazon OpenSearch Service (managed Elasticsearch) for full-text search, dashboards, and log-based alerting.
- Amazon CloudWatch Logs as a secondary destination for compliance retention (cheaper long-term storage).
Structure your application logs as JSON from the start. Unstructured logs that require complex regex parsing will cause you operational pain at 2 AM. Each log entry should include at minimum: timestamp, log level, correlation/trace ID, component name, and the actual message.
Distributed Traces
Deploy an OpenTelemetry Collector as a Deployment in your cluster. Configure your applications to export traces via OTLP to the collector, which then forwards to:
- AWS X-Ray — native EKS integration, service maps, latency histograms.
- Jaeger (self-hosted) — full control, good for high-cardinality trace data.
Traces are the only way to understand latency in a multi-service call chain. When a regulatory report takes 45 seconds instead of 5, traces tell you which service and which database query is responsible.
SLO-Based Alerting
Define Service Level Objectives before you configure alerts. An SLO answers: “What does acceptable performance look like for our users?” Then configure alerts based on burn rate against that SLO — not on arbitrary threshold crossings.
Example SLOs for an enterprise reporting platform:
- Admin application availability: 99.9% over 30 days (allows 43 minutes of downtime)
- Report generation p95 latency: < 30 seconds
- Processing engine job success rate: 99.5%
Use Prometheus recording rules to compute error budget burn rates, and alert when you are burning your error budget faster than sustainable. This dramatically reduces alert noise compared to threshold-based alerting.
Dashboards
Every component should have a Grafana dashboard. Organize dashboards in a hierarchy:
- Business layer: jobs completed, reports generated, active users
- Application layer: per-service latency, error rates, JVM metrics
- Infrastructure layer: node CPU/memory, disk I/O, network throughput
- Kubernetes layer: pod restarts, pending pods, PVC utilization, HPA state
Version-control your dashboards as JSON in Git. Deploy them via Grafana’s provisioning mechanism (ConfigMaps) so they are reproducible across environments.
7. Disaster Recovery: Planning for Failure at Every Layer
Define Your RTO and RPO First
Recovery Time Objective (RTO) — how long can the system be unavailable? Recovery Point Objective (RPO) — how much data can you afford to lose? These are business decisions, not technical ones. Get explicit agreement from stakeholders before you design your DR architecture. Without them, you will either over-engineer (expensive) or under-engineer (catastrophic).
Multi-AZ is Not DR
Multi-AZ protects against a single datacenter failure. It does not protect against an AWS regional outage, an accidental mass-delete of resources, a ransomware attack that encrypts your databases, or a Kubernetes upgrade gone wrong. True DR requires a separate region.
Database DR
Your Kubernetes workloads are only as available as your databases:
- Use managed database services (Amazon RDS) with Multi-AZ enabled. Multi-AZ provides synchronous replication and automatic failover in 60–120 seconds.
- Enable automated backups with a retention period that meets your RPO.
- Configure a cross-region read replica in your DR region. In a DR scenario, you promote the read replica to a standalone instance.
- Test the failover process. An untested DR plan is not a DR plan.
Cluster-Level Backup with Velero
Velero backs up Kubernetes object definitions (Deployments, StatefulSets, ConfigMaps, Secrets, PVCs) and PersistentVolume data to S3. Configure:
- Daily full backups of your production namespace
- Hourly incremental backups during business hours
- 30-day retention for daily backups, 7-day for hourly
- Cross-region replication of the S3 backup bucket
Restore Drills
Run a restore drill monthly. Restore to a staging namespace from a production backup and validate that all services start, database connections work, and key user journeys succeed. This is the only way to know that your backup is actually usable. Document the time taken — that is your actual RTO.
Graceful Pod Shutdown
In-memory stateful workloads (Ignite grids, JVM applications with large heaps) need time to drain connections, replicate data to remaining nodes, and complete in-flight requests before they are killed. Configure terminationGracePeriodSeconds generously for these workloads (120–180 seconds), and implement a preStop lifecycle hook to initiate the graceful drain process before Kubernetes sends SIGTERM.
Without this, a rolling update, node drain, or pod eviction will cause data loss or corrupt in-flight transactions.
PodDisruptionBudgets
A PodDisruptionBudget (PDB) is your safeguard against voluntary disruptions — node drains for maintenance, EKS upgrades, spot instance reclamation — taking down too many replicas simultaneously:
# Stateless services: allow at most 1 unavailable at a time
maxUnavailable: 1

# Stateful grid members: never go below 1 available
minAvailable: 1
Without PDBs, a node drain during an EKS version upgrade can evict all replicas of a service in parallel, causing a complete outage.
8. Performance: Tuning Compute, Storage, and JVM
Set Resource Requests and Limits Accurately
Resource requests determine scheduling — they define the minimum resources the scheduler reserves for a pod. Limits define the ceiling. The key rules:
- Always set both requests and limits. Pods without requests are
BestEffortclass and are the first to be evicted under node pressure. - For CPU, limits can be significantly higher than requests (burstable workloads). For memory, set limits close to requests for stateful workloads — memory overcommit leads to OOMKill, which is a hard restart.
- For JVM applications, the sum of
-Xmx(heap) plus off-heap memory (direct buffers, metaspace, Ignite off-heap regions) must be less than the pod’s memory limit. If the total exceeds the limit, the pod will be OOMKilled by the kernel, not by the JVM garbage collector — you get no heap dump, no warning.
Storage Class Selection
Choose storage classes based on access pattern:
- EBS gp3 — general-purpose block storage. Better baseline IOPS than gp2 at the same cost. Use for single-pod stateful workloads (ReadWriteOnce).
- EBS io2 Block Express — high-performance block storage for workloads requiring >16,000 IOPS. Use for PE off-heap persistence and database data directories.
- EFS (Elastic File System) — fully managed NFS. Use for ReadWriteMany PVCs where multiple pods need to access the same storage (shared content stores, shared log volumes). Lower IOPS than EBS; do not use for latency-sensitive off-heap I/O.
Node-Level Kernel Tuning
In-memory grid workloads and search engines require kernel parameter adjustments that the default EKS AMI does not provide. Apply these via a DaemonSet that runs a privileged init container, or via EC2 launch template user data:
sysctl -w vm.max_map_count=262144    # required for Lucene, Ignite
sysctl -w net.core.somaxconn=65535   # larger connection queue
sysctl -w vm.swappiness=1            # near-zero swap for in-memory grids
ulimit -n 65535                      # file descriptor limit
Direct I/O for Off-Heap Persistence
For workloads that write large sequential data to disk (off-heap persistence, WAL journals), enable Direct I/O to bypass the OS page cache. This prevents the off-heap writes from evicting application data from the page cache, which would cause unexpected latency spikes in read workloads. Most enterprise grid frameworks support this as a configuration flag.
Connection Pool Sizing
Database connection pools must be sized based on actual concurrency requirements, not defaults. Too small and you get queuing; too large and you overwhelm the database. A simple heuristic: start with maxPoolSize = (database_vCPUs * 4) across all application instances, then tune based on observed wait times. Monitor pool utilization metrics and alert when average utilization exceeds 80%.
9. GitOps and Release Governance
Never Deploy Manually to Production
Manual helm upgrade commands run by engineers are error-prone, unauditable, and inconsistent. The definition of production infrastructure is: the state in Git is the truth. ArgoCD or Flux continuously reconciles the cluster state to match what is in Git. Any deviation is flagged as drift and can be automatically or manually corrected.
Separate Config Repository from Application Repository
Store Helm values files for each environment in a dedicated configuration repository, separate from the application/chart repository. This separation means:
- A developer changing application code cannot accidentally change production configuration.
- Configuration changes have their own review and approval workflow.
- You can see exactly what configuration was applied to production at any point in history (
git log).
Branch Protection and Deployment Gates
Require at least two reviewers for changes to production configuration. Require passing CI checks (lint, schema validation, security scan) before merge. Never allow force-pushes to the production configuration branch.
Helm Chart Validation in CI
Every change to a Helm chart should run through a validation pipeline before it is deployable to any environment:
helm lint— catches YAML syntax errors and templating issues.helm template | kubeval— validates that rendered Kubernetes manifests match the Kubernetes API schema.helm template | kube-score— scores manifests against best practices (readiness probes defined, resource limits set, etc.).helm unittest— unit tests for complex templating logic.helm upgrade --dry-runagainst a staging cluster — validates that the chart installs cleanly in the actual target environment.
10. Deployment Safety: Protecting Production
Canary Deployments for Stateless Services
Never cut over 100% of traffic to a new version in a single step. Use Argo Rollouts to implement a canary strategy for stateless application components:
- Deploy new version. Route 10% of traffic to it.
- Monitor error rates and latency for 5 minutes.
- Promote to 50% if metrics are healthy.
- Monitor for 10 minutes.
- Promote to 100%.
If any step produces degraded metrics, roll back automatically. This reduces the blast radius of a bad deployment from “all users affected” to “10% of users for 5 minutes.”
Controlled StatefulSet Upgrades
For StatefulSets (database engines, grid members), use the partition field in RollingUpdate strategy. Start by updating the highest-ordinal replica first. Verify it is healthy before updating the next. This gives you a manual checkpoint between each replica upgrade — critical for workloads where a bad upgrade might only manifest after the node joins the grid and begins data exchange.
Post-Upgrade Smoke Tests
Implement a Kubernetes Job as a Helm post-upgrade hook that runs smoke tests immediately after every deployment. The job should check that all service heartbeat endpoints return HTTP 200, that the grid has the expected number of members, and that a sample business operation completes successfully. If any test fails, the Helm hook fails, and the release is flagged for investigation.
Built-In Memory Validation
For JVM workloads with complex memory configurations, add Helm template guards that validate memory configuration consistency before the chart is even rendered. For example: the pod memory limit must be greater than heap + all off-heap regions. Fail the Helm install with a descriptive error message if this constraint is violated. Catching misconfiguration at deploy time is infinitely better than diagnosing OOMKill events at 3 AM.
11. Cost Governance
Tag Everything
Apply consistent tags to all AWS resources: environment, team, application, cost-center. Use AWS Cost Explorer with tag-based grouping to track spend per team and per environment. Without tagging, your cloud bill is opaque and cost optimization is guesswork.
Spot Instances for Batch Workloads
Spot instances are AWS’s spare capacity, offered at 60–90% discount. They can be reclaimed with a 2-minute warning. This interruption risk is acceptable for batch calculation workloads that can checkpoint and restart, but is not acceptable for stateful primary workloads. Implement Karpenter NodePools that try spot first and fall back to on-demand if spot capacity is unavailable in your target AZs.
Rightsize Before You Scale
The most common waste in Kubernetes is over-provisioned resource requests. Pods request 4 CPU but average 0.3 CPU in production. The scheduler sees 4 CPU reserved and will not schedule other workloads on that node capacity. Use VPA recommendations and Kubernetes resource utilization metrics to bring requests within 20% of actual average usage. This alone typically reduces your node count by 30–40% on mature platforms.
Storage Lifecycle Management
Implement S3 lifecycle policies on log buckets and backup buckets: transition to S3 Infrequent Access after 30 days, Glacier after 90 days. Configure EBS volume expiry for unattached volumes. Old PVCs from deleted StatefulSets will continue incurring charges indefinitely if not cleaned up.
12. Compliance and Audit
Kubernetes Audit Logging
Enable Kubernetes API server audit logging on your EKS control plane and ship logs to CloudWatch Logs. Configure the audit policy to log all RBAC decisions, secret reads, exec/attach/portforward events, and resource creates/deletes. Set a retention period appropriate for your regulatory requirements (typically 1–7 years in financial services). These logs are your evidence trail for access audits and incident investigations.
AWS CloudTrail
All EKS API calls, IAM role assumptions, and Secrets Manager access events are captured in CloudTrail. Enable CloudTrail across all regions (including regions you are not actively using — attackers exploit gaps). Configure multi-region trails with S3 log file validation and integrity alerts.
CIS Benchmark Compliance
Run kube-bench against your EKS nodes and control plane to assess compliance with the CIS Kubernetes Benchmark. For EKS specifically, run the EKS-specific benchmark checks (CIS Amazon EKS Benchmark v1.4). Address all Level 1 (scored) findings before going to production. Schedule quarterly re-runs and treat regressions as security incidents.
Software Bill of Materials (SBOM)
Generate an SBOM for every container image using Syft or Trivy. Store SBOMs in your artifact registry alongside the images. In the event of a zero-day vulnerability disclosure (e.g., a new Log4Shell-class vulnerability), an SBOM allows you to immediately query which of your running images are affected, rather than manually inspecting every container.
13. Day-2 Operations
EKS Version Currency
EKS supports Kubernetes N and N-2 minor versions. Standard support ends 14 months after a version’s release; extended support is available but costly. Establish a quarterly EKS upgrade cadence. Using Karpenter with drift detection, node replacement on new AMIs becomes automatic — nodes are replaced rolling when a newer AMI is available, without requiring manual node group operations.
Certificate Lifecycle
If you use cert-manager (you should), configure certificate renewal well in advance of expiry (15 days before for a 900-day certificate, as a starting point). Monitor certificate expiry as a metric in Prometheus and alert at 30 days, 14 days, and 7 days remaining. An expired TLS certificate in a financial services platform is an immediate incident — all inter-service mTLS breaks simultaneously.
Dependency Currency
Maintain a software inventory of Helm chart versions, container image versions, and cluster add-on versions. Subscribe to CVE feeds for your key dependencies. Establish an SLA for patching: critical CVEs within 72 hours, high within 14 days, medium within 30 days. Automate dependency update PRs with Renovate Bot or Dependabot, requiring human review before merge.
Runbook Culture
Every alert in Alertmanager should link to a runbook. A runbook is a step-by-step guide for diagnosing and resolving the alert condition. Runbooks should be stored in Git (not a wiki that goes stale), version-controlled, and reviewed quarterly. An alert without a runbook is an invitation to improvise at 2 AM — that is when costly mistakes happen.
Chaos Engineering
After your DR and resilience controls are in place, validate them with controlled failure injection. Tools like AWS Fault Injection Simulator (FIS) or LitmusChaos allow you to inject:
- Node failures (terminate a random node in a node group)
- AZ outages (block network traffic to/from an AZ)
- Pod failures (kill random pods in a deployment)
- Latency injection (add 500ms to database calls)
Run chaos experiments in staging first. Graduate to production during low-traffic windows with a defined abort condition. The goal is not to cause outages — it is to find weaknesses before your customers find them.
14. The Pre-Go-Live Checklist
Use this as a gate before any production deployment:
Infrastructure
- [ ] Cluster spans 3 AZs with dedicated node groups per workload class
- [ ] All required add-ons installed and healthy (CSI drivers, ALB controller, cert-manager, Secrets Store CSI, External-DNS, Karpenter)
- [ ] EKS control plane audit logging enabled and shipping to CloudWatch
- [ ] KMS envelope encryption enabled for etcd secrets
Reliability
- [ ] PodDisruptionBudgets defined for all production workloads
- [ ] Liveness, readiness, and startup probes configured for all containers
- [ ]
terminationGracePeriodSecondsset appropriately for each workload - [ ] Pod anti-affinity or topology spread constraints enforced for replicated services
- [ ] Velero backup configured, tested, and restore drill completed
- [ ] RDS Multi-AZ enabled with automated backups
Security
- [ ] No secrets in Git, pom.xml, or ConfigMaps
- [ ] All secrets in AWS Secrets Manager, mounted via CSI driver
- [ ]
readOnlyRootFilesystem: trueon all containers - [ ]
runAsNonRoot: trueon all containers - [ ]
allowPrivilegeEscalation: falseon all containers - [ ] Network policies enforced (default deny applied)
- [ ] All container images scanned, no unpatched CRITICAL CVEs
- [ ] Image signing enabled and admission verification enforced
- [ ] IRSA configured for all ServiceAccounts that need AWS API access
- [ ] Falco deployed and alerting
- [ ] CIS benchmark Level 1 findings resolved
Observability
- [ ] Prometheus scraping all pods and nodes
- [ ] Fluent Bit deployed and shipping logs to OpenSearch/CloudWatch
- [ ] OpenTelemetry collector deployed, traces flowing to X-Ray or Jaeger
- [ ] SLOs defined and Alertmanager rules configured
- [ ] Grafana dashboards for all production components
- [ ] Certificate expiry monitoring active
Deployment
- [ ] GitOps pipeline (ArgoCD or Flux) managing all production deployments
- [ ] Helm chart lint, kubeval, and kube-score passing in CI
- [ ] Post-upgrade smoke tests implemented as Helm hooks
- [ ] Memory configuration guards active (
helm.testMemoryConfiguration: true) - [ ] Canary strategy configured for stateless deployments
- [ ] StatefulSet partition upgrade procedure documented
- [ ] Rollback procedure documented and tested
Cost and Compliance
- [ ] Resource quotas applied to production namespace
- [ ] All AWS resources tagged with team, environment, cost-center
- [ ] Spot instances configured for appropriate workloads
- [ ] CloudTrail enabled multi-region
- [ ] Audit log retention period meets regulatory requirements
Closing Thoughts
The gap between a Kubernetes cluster that runs your workloads and a Kubernetes cluster that runs your workloads reliably, securely, and efficiently at scale is significant. Each practice in this guide addresses a specific failure mode — an outage that happened to someone, a security incident that cost a company dearly, a compliance finding that required emergency remediation.
Not every practice needs to be in place before your first production deployment. Prioritize by risk:
- Security controls (secret management, image scanning, non-root containers) — these prevent irreversible incidents.
- Reliability controls (PDBs, probes, graceful shutdown, backups) — these protect your SLA.
- Observability (metrics, logs, traces) — these give you the ability to diagnose and recover quickly.
- Scalability and performance tuning — these can be iteratively improved after go-live.
- GitOps, cost governance, chaos engineering — important for long-term operational health but not blocking for initial launch.
Treat your infrastructure configuration as software: version it, review it, test it, and document it. The cluster you deploy to production today will be maintained by engineers who are not present in this planning discussion. Leave them a system they can understand, operate, and improve.